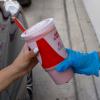
Before the pandemic, millions of consumers spun through the drive thru on their way to or from work. But now? It’s clear that the home is where they’re spending most of their time. (The below figures represent percentage of study respondents.)
| visit purpose | percent of most recent drivethru experience |
| Other | 5 |
| Long journey or road trip | 6 |
| Left work to bring order home | 6 |
| Left work to bring order back to work | 6 |
| Left home to bring order to work | 6 |
| Left home to bring order back home | 72 |
2020 QSR drive-thru performance study Methodology
The FoodserviceResults team conducted a comprehensive, nationally representative survey of drive-thru consumers in the U.S. using an online survey sample. Participants in the research were screened for frequency of use as well as numerous demographic characteristics in order to ensure that the respondent base was reflective of the U.S. drive-thru market.
Leveraging insights from numerous industry experts, the finalized survey was completed among 1,007 drive-thru consumers during fieldwork. To ensure a relevant respondent base was achieved, all participants were screened to include those who had at least one drive-thru occasion in the last 30 days. An extensive cross tabulation of the respondent sample data was conducted in order to identify major trends, demographic/behavioral themes, and other nuances in the data.