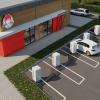
Ah, the drive thru. The bastion of simpler times. The slice of Americana that, even as the rest of the world changes all around us, remains our unwavering access point to cheap, convenient food.
If only that were true. As with most other elements of the restaurant operation, the drive-thru lane is in the midst of a digital upheaval, a complete evolution that is rethinking the customer experience and making more efficient the complicated back-of-house. What began a decade ago as a shift toward LED menuboards and high-quality speakers and headsets has since become an embrace of a top-to-bottom digital experience that begins as early as the customer's home or office.
How did we get here? Put simply, Americans increasingly demanded cheap-yet-quality food while they were on the go, and drive-thru speed of service and order accuracy could only go so far in the fight for market share. Digital menuboards dressed up the drive-thru presentation while lending operators more control over their menu layout and promotions. Tablet technology allowed some brands (ahem, Chick-fil-A) to look beyond dual lanes in the fight against bottlenecks. And a new fleet of POS services provided foundational support to the team members in the back of the house.
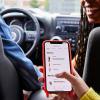
Then, about a half-decade ago, the second innovation wave crashed down on the industry. Mobile ordering became the trend du jour among drive-thru strategists, with many of them certain that a mobile strategy could alter the drive-thru experience as we know it. And to some degree, that has come to pass; Dunkin' has been rolling out mobile-order-only lanes, while fast casuals like Chipotle and CAVA are investing in drive thru for the first time with windows for mobile order pickup.
But mobile ordering seems almost quaint compared with the latest murmurs among the drive thru in-crowd. The newest buzzword is AI—artificial intelligence—which could improve the drive-thru operation by replacing the employee at the speaker, recognizing each car's past orders, or simply predicting what the customer might want to order at that particular time of day. Case in point: McDonald's acquired Dynamic Yield for more than $300 million back in March, and it could prove to be one of the single most consequential moments in industry history. The Golden Arches intend to use that company's powerful data technology to tailor the drive-thru menuboard according to weather, traffic patterns, trending items, or the customer's order in process.
With so much innovation at hand, the questions remain: How is drive-thru performance holding up? And what are brands doing to maintain their drive-thru fundamentals?